

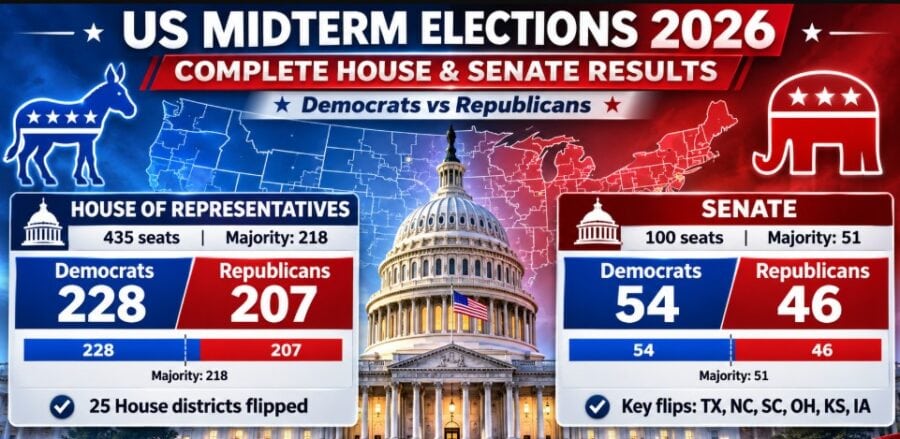

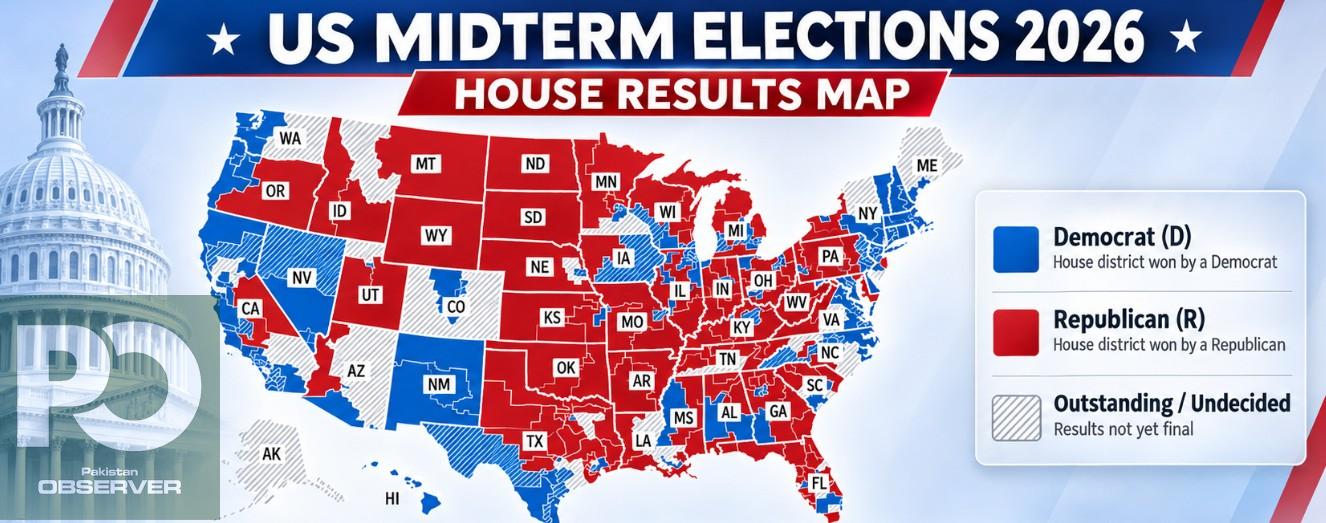
WASHINGTON – Democrats stunned the world, seucint 242 of 435 House seats in 2026 US midterm elections, 24 more than the 218 needed for a majority, while Republicans hold 146 and 47 races remain uncalled.
Democrats are in driving seat after 2026 midterms, making large gains in traditionally Republican territory. The right-wing populist cannot reach majority even if they win every uncalled race, since 146 plus 47 gives them a maximum of 193 seats. The swing is not limited to the House. Across the Senate races in results, Democrats won or lead 20 contests, Republicans 13, and one (Mississippi) is too close to call. Democrats also won 22 of the 35 governor’s races reported, Republicans 12, and Kansas is too close to call.
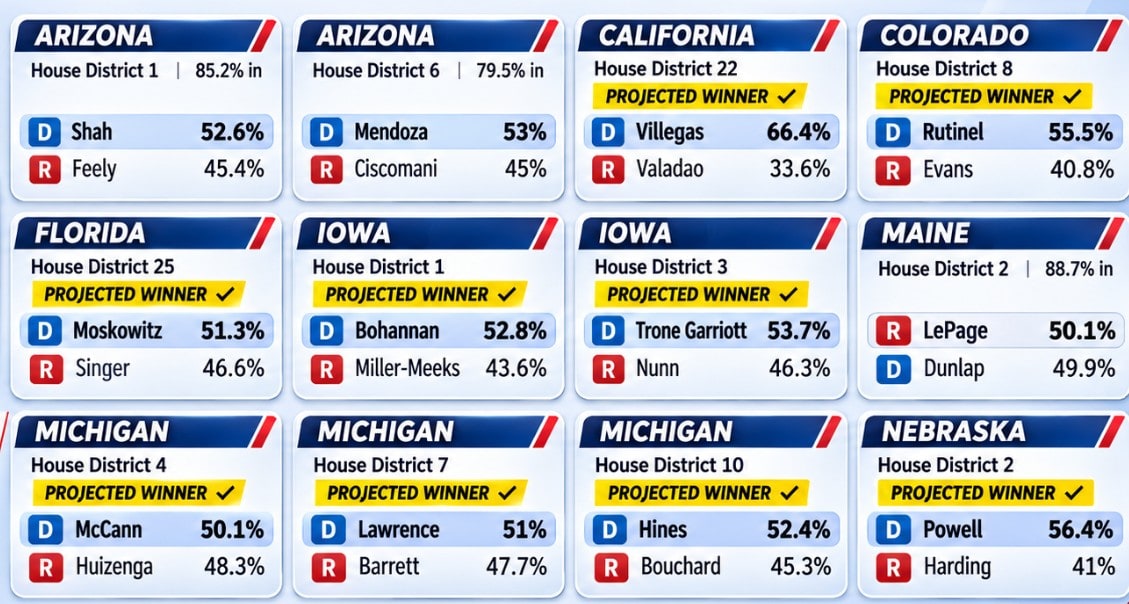
California (6 uncalled), Arizona (5), Florida (5), New York (4) and Texas (4) hold most of the seats still undecided, so the final House count can still move. Many districts were also reporting less than 100% of votes, so margins in the closest races may change.
House results 2026
Democrats hold 55.6% of House seats, Republicans 33.6%, and 10.8% are still uncalled. A party needs 218 seats for a majority.
| Party | Seats | Share of 435 | Against 218 majority |
| Democrats | 242 | 55.6% | 24 above |
| Republicans | 146 | 33.6% | 72 short |
| Uncalled | 47 | 10.8% | Cannot change the outcome |
| Total | 435 | 100% |
Democratic House seats
Fourteen districts are marked as flips, and all of them moved from Republican to Democratic hands. Iowa has three flips, while Virginia and Wisconsin have two each.
| District | Winner (Democrat) | Defeated or trailing Republican | Reporting |
| California 1 | Mike McGuire, 57.0% | James Gallagher (inc.), 43.0% | 50.1% |
| Iowa 1 | Christina Bohannan, 52.8% | Mariannette Miller-Meeks (inc.), 43.6% | 99% |
| Iowa 2 | Lindsay James, 49.5% | Joe Mitchell, 45.6% | 99% |
| Iowa 3 | Sarah Trone Garriott, 53.7% | Zach Nunn (inc.), 46.3% | 98.8% |
| Michigan 4 | Sean McCann, 50.1% | Bill Huizenga (inc.), 48.3% | 96.7% |
| Missouri 2 | Fred Wellman, 51.1% | Ann Wagner (inc.), 46.2% | 99% |
| Nebraska 2 | Denise Powell, 56.4% | Brinker Harding, 41.0% | 87.3% |
| Nevada 2 | Teresa Benitez-Thompson, 50.7% | David Flippo, 44.1% | 88.9% |
| Pennsylvania 1 | Bob Harvie, 52.7% | Brian Fitzpatrick (inc.), 47.3% | 98.4% |
| Utah 1 | Ben McAdams, 71.9% | Riley Owen, 24.9% | 60% |
| Virginia 1 | Shannon Taylor, 51.0% | Rob Wittman (inc.), 48.7% | 98.5% |
| Virginia 2 | Elaine Luria, 53.1% | Jen Kiggans (inc.), 44.6% | 97.7% |
| Wisconsin 1 | Mitchell Berman, 52.0% | Bryan Steil (inc.), 48.0% | 99% |
| Wisconsin 3 | Rebecca Cooke, 52.4% | Derrick Van Orden (inc.), 45.8% | 99% |
State-by-state House results
Democrats lead in 25 state delegations and Republicans in 21, while Nebraska, Ohio and Wisconsin are tied and Alaska is uncalled. Nine states have sent an all-Democratic delegation and seven an all-Republican one.
| State | Seats | Democrats | Republicans | Uncalled | Lead |
| Alabama | 7 | 2 | 5 | 0 | Republican |
| Alaska | 1 | 0 | 0 | 1 | Uncalled |
| Arizona | 9 | 3 | 1 | 5 | Democratic |
| Arkansas | 4 | 0 | 4 | 0 | Republican |
| California | 52 | 44 | 2 | 6 | Democratic |
| Colorado | 8 | 5 | 0 | 3 | Democratic |
| Connecticut | 5 | 5 | 0 | 0 | Democratic |
| Delaware | 1 | 1 | 0 | 0 | Democratic |
| Florida | 28 | 7 | 16 | 5 | Republican |
| Georgia | 14 | 5 | 9 | 0 | Republican |
| Hawaii | 2 | 2 | 0 | 0 | Democratic |
| Idaho | 2 | 0 | 2 | 0 | Republican |
| Illinois | 17 | 14 | 3 | 0 | Democratic |
| Indiana | 9 | 3 | 6 | 0 | Republican |
| Iowa | 4 | 3 | 1 | 0 | Democratic |
| Kansas | 4 | 1 | 3 | 0 | Republican |
| Kentucky | 6 | 2 | 4 | 0 | Republican |
| Louisiana | 6 | 1 | 3 | 2 | Republican |
| Maine | 2 | 1 | 0 | 1 | Democratic |
| Maryland | 8 | 7 | 1 | 0 | Democratic |
| Massachusetts | 9 | 9 | 0 | 0 | Democratic |
| Michigan | 13 | 9 | 4 | 0 | Democratic |
| Minnesota | 8 | 4 | 3 | 1 | Democratic |
| Mississippi | 4 | 1 | 3 | 0 | Republican |
| Missouri | 8 | 3 | 5 | 0 | Republican |
| Montana | 2 | 0 | 1 | 1 | Republican |
| Nebraska | 3 | 1 | 1 | 1 | Tied |
| Nevada | 4 | 4 | 0 | 0 | Democratic |
| New Hampshire | 2 | 2 | 0 | 0 | Democratic |
| New Jersey | 12 | 10 | 1 | 1 | Democratic |
| New Mexico | 3 | 3 | 0 | 0 | Democratic |
| New York | 26 | 19 | 3 | 4 | Democratic |
| North Carolina | 14 | 9 | 2 | 3 | Democratic |
| North Dakota | 1 | 0 | 1 | 0 | Republican |
| Ohio | 15 | 7 | 7 | 1 | Tied |
| Oklahoma | 5 | 0 | 5 | 0 | Republican |
| Oregon | 6 | 5 | 1 | 0 | Democratic |
| Pennsylvania | 17 | 11 | 6 | 0 | Democratic |
| Rhode Island | 2 | 2 | 0 | 0 | Democratic |
| South Carolina | 7 | 1 | 4 | 2 | Republican |
| South Dakota | 1 | 0 | 1 | 0 | Republican |
| Tennessee | 9 | 0 | 7 | 2 | Republican |
| Texas | 38 | 14 | 20 | 4 | Republican |
| Utah | 4 | 1 | 2 | 1 | Republican |
| Vermont | 1 | 1 | 0 | 0 | Democratic |
| Virginia | 11 | 8 | 2 | 1 | Democratic |
| Washington | 10 | 8 | 0 | 2 | Democratic |
| West Virginia | 2 | 0 | 2 | 0 | Republican |
| Wisconsin | 8 | 4 | 4 | 0 | Tied |
| Wyoming | 1 | 0 | 1 | 0 | Republican |
| United States | 435 | 242 | 146 | 47 | Democratic |
Closest races to watch
Seven districts are separated by about one percentage point or less, and the margin in each is a few thousand votes at most. Because counting is incomplete in some of them, these are the races most likely to change.
| District | Leading | Trailing | Margin (votes) | Reporting |
| Arizona 2 | Jonathan Nez (D), 49.2% | Eli Crane (R, inc.), 49.1% | 86 | 83.5% |
| North Carolina 3 | Greg Murphy (R, inc.), 49.4% | Raymond Smith (D), 49.3% | 233 | 99% |
| Tennessee 4 | Victoria Broderick (D), 48.9% | Scott DesJarlais (R, inc.), 48.7% | 280 | 99% |
| Minnesota 1 | Jake Johnson (D), 50.0% | Brad Finstad (R, inc.), 49.9% | 323 | 98.8% |
| Maine 2 | Paul LePage (R), 50.1% | Matthew Dunlap (D), 49.8% | 920 | 88.8% |
| South Carolina 2 | Joe Wilson (R, inc.), 49.8% | Zyon Khalifa (D), 48.8% | 3,027 | 99% |
| South Carolina 1 | Nancy Lacore (D), 49.7% | Jenny Costa Honeycutt (R), 48.6% | 3,308 | 99% |
California 4 is a Democrat-versus-Democrat contest: Eric Jones leads incumbent Mike Thompson 51.8% to 48.2% with 40.7% of votes counted.
US Senate Results 2026
Democrats have won or lead 20 of the 34 Senate races in the results and Republicans 13, with Mississippi too close to call. Six races are marked as flips: Iowa, Kansas, Maine, North Carolina, South Carolina and Texas.
| State | Leading | Trailing |
| Alabama | Barry Moore (R), 54.7% | Everett Wess (D), 45.3% |
| Arkansas | Tom Cotton (R, inc.), 54.3% | Hallie Shoffner (D), 42.4% |
| Colorado | John Hickenlooper (D, inc.), 60.2% | Mark Baisley (R), 35.6% |
| Delaware | Chris Coons (D, inc.), 63.6% | Mike Katz (R), 36.4% |
| Florida | Ashley Moody (R, inc.), 50.9% | Angie Nixon (D), 48.0% |
| Georgia | Jon Ossoff (D, inc.), 59.0% | Mike Collins (R), 41.0% |
| Idaho | Jim Risch (R, inc.), 56.5% | Todd Achilles (I), 33.5% |
| Illinois | Juliana Stratton (D), 61.0% | Don Tracy (R), 37.4% |
| Iowa | Josh Turek (D), 50.5% | Ashley Hinson (R), 46.4% |
| Kansas | Adam Hamilton (D), 50.9% | Roger Marshall (R, inc.), 46.1% |
| Kentucky | Andy Barr (R), 55.0% | Charles Booker (D), 42.9% |
| Louisiana | Julia Letlow (R), 50.9% | Jamie Davis (D), 49.1% |
| Maine | Troy Jackson (D), 53.6% | Susan Collins (R, inc.), 46.4% |
| Massachusetts | Ed Markey (D, inc.), 63.3% | John Deaton (R), 32.3% |
| Michigan | Abdul El-Sayed (D), 52.5% | Mike Rogers (R), 45.5% |
| Minnesota | Peggy Flanagan (D), 53.7% | Michele Tafoya (R), 43.6% |
| Mississippi | Scott Colom (D), 48.9% | Cindy Hyde-Smith (R, inc.), 48.9% |
| Montana | Kurt Alme (R), 48.8% | Alani Bankhead (D), 12.0% |
| Nebraska | Pete Ricketts (R, inc.), 50.4% | Dan Osborn (I), 43.6% |
| New Hampshire | Chris Pappas (D), 56.0% | John Sununu (R), 42.0% |
| New Jersey | Cory Booker (D, inc.), 62.1% | Justin Murphy (R), 35.3% |
| New Mexico | Ben Ray Lujan (D, inc.), 63.2% | Larry Marker (R), 36.8% |
| North Carolina | Roy Cooper (D), 58.7% | Michael Whatley (R), 39.1% |
| Ohio | Sherrod Brown (D), 50.0% | Jon Husted (R, inc.), 45.2% |
| Oklahoma | Kevin Hern (R), 57.2% | N’Kiyla Jasmine Thomas (D), 39.3% |
| Oregon | Jeff Merkley (D, inc.), 56.6% | David Brock Smith (R), 40.5% |
| Rhode Island | Jack Reed (D, inc.), 66.6% | Raymond McKay (R), 29.4% |
| South Carolina | Annie Andrews (D), 51.1% | Darline Graham (R, inc.), 46.7% |
| South Dakota | Mike Rounds (R, inc.), 60.5% | Brian Bengs (I), 39.5% |
| Tennessee | Bill Hagerty (R, inc.), 55.1% | Marquita Bradshaw (D), 42.9% |
| Texas | James Talarico (D), 55.1% | Ken Paxton (R), 43.0% |
| Virginia | Mark Warner (D, inc.), 61.1% | Bert Mizusawa (R), 38.7% |
| West Virginia | Shelley Moore Capito (R, inc.), 58.3% | Rachel Fetty Anderson (D), 37.9% |
| Wyoming | Harriet Hageman (R), 65.2% | James Byrd (D), 34.8% |
Governor results
Democrats have won 22 of the 35 governor’s races in the results and Republicans 12, with Kansas too close to call. Five races are marked as flips to the Democrats: Georgia, Iowa, Nevada, Ohio and Texas.
| State | Leading | Trailing |
| Alabama | Tommy Tuberville (R), 52.1% | Doug Jones (D), 47.9% |
| Arizona | Katie Hobbs (D, inc.), 55.6% | Andy Biggs (R), 42.7% |
| Arkansas | Sarah Huckabee Sanders (R, inc.), 53.9% | Fred Love (D), 38.6% |
| California | Xavier Becerra (D), 64.0% | Steve Hilton (R), 36.0% |
| Colorado | Phil Weiser (D), 60.9% | Victor Marx (R), 33.6% |
| Connecticut | Ned Lamont (D, inc.), 58.8% | Ryan Fazio (R), 41.2% |
| Florida | Byron Donalds (R), 50.0% | David Jolly (D), 48.7% |
| Georgia | Keisha Lance Bottoms (D), 54.3% | Rick Jackson (R), 45.7% |
| Hawaii | Josh Green (D, inc.), 73.4% | Gary Cordery (R), 26.6% |
| Idaho | Brad Little (R, inc.), 57.1% | Terri Pickens (D), 32.3% |
| Illinois | JB Pritzker (D, inc.), 59.8% | Darren Bailey (R), 36.8% |
| Iowa | Rob Sand (D), 55.5% | Zach Lahn (R), 44.5% |
| Kansas | Cindy Holscher (D), 50.3% | Ty Masterson (R), 49.7% |
| Maine | Hannah Pingree (D), 54.9% | Bobby Charles (R), 37.0% |
| Maryland | Wes Moore (D, inc.), 62.7% | Dan Cox (R), 33.2% |
| Massachusetts | Maura Healey (D, inc.), 62.0% | Michael Minogue (R), 34.7% |
| Michigan | Jocelyn Benson (D), 54.5% | John James (R), 43.8% |
| Minnesota | Amy Klobuchar (D), 55.5% | Lisa Demuth (R), 42.6% |
| Nebraska | Jim Pillen (R, inc.), 50.8% | Lynne Walz (D), 42.2% |
| Nevada | Aaron Ford (D), 51.7% | Joe Lombardo (R, inc.), 44.2% |
| New Hampshire | Kelly Ayotte (R, inc.), 51.3% | Cinde Warmington (D), 47.1% |
| New Mexico | Deb Haaland (D), 57.2% | Greggory Hull (R), 42.8% |
| New York | Kathy Hochul (D, inc.), 60.0% | Bruce Blakeman (R), 39.8% |
| Ohio | Amy Acton (D), 52.3% | Vivek Ramaswamy (R), 44.4% |
| Oklahoma | Mike Mazzei (R), 51.9% | Cyndi Munson (D), 45.9% |
| Oregon | Tina Kotek (D, inc.), 51.7% | Christine Drazan (R), 45.5% |
| Pennsylvania | Josh Shapiro (D, inc.), 60.4% | Stacy Garrity (R), 38.3% |
| Rhode Island | Helena Foulkes (D), 57.6% | Aaron Guckian (R), 13.2% |
| South Carolina | Alan Wilson (R), 51.6% | Jermaine Johnson (D), 47.1% |
| South Dakota | Larry Rhoden (R, inc.), 63.5% | Dan Ahlers (D), 36.5% |
| Tennessee | Marsha Blackburn (R), 45.5% | Jerri Green (D), 43.0% |
| Texas | Gina Hinojosa (D), 52.8% | Greg Abbott (R, inc.), 45.7% |
| Vermont | Phil Scott (R, inc.), 52.6% | Amanda Janoo (D), 45.6% |
| Wisconsin | David Crowley (D), 54.1% | Tom Tiffany (R), 45.9% |
| Wyoming | Eric Barlow (R), 68.6% | Kenneth Casner (D), 14.7% |
District Results
155 House districts with candidate-level results, listing the leading and trailing candidate with votes, vote share and the share of votes counted. States with fewer districts listed than seats are only partly covered here.
| District | Leading | Trailing |
| Alabama 1 | Jerry Carl (R) 137,025 · 59.1% | Clyde Jones (D) 94,940 · 40.9% |
| Alabama 2 | Shomari Figures (inc.) (D) 124,422 · 53.8% | Rhett Marques (R) 107,049 · 46.2% |
| Alabama 3 | Mike Rogers (inc.) (R) 141,800 · 64.0% | Lee McInnis (D) 79,926 · 36.0% |
| Alabama 4 | Robert Aderholt (inc.) (R) 160,008 · 74.9% | Amanda Pusczek (D) 53,633 · 25.1% |
| Alabama 5 | Dale Strong (inc.) (R) 142,080 · 53.2% | Andrew Sneed (D) 124,763 · 46.8% |
| Alabama 6 | Gary Palmer (inc.) (R) 149,921 · 57.5% | Maurice Mercer (D) 110,957 · 42.5% |
| Alabama 7 | Terri Sewell (inc.) (D) 174,823 · 69.4% | Ammie Akin (R) 77,085 · 30.6% |
| Arizona 1 | Amish Shah (D) 163,584 · 52.6% | Jay Feely (R) 141,196 · 45.4% |
| Arizona 2 | Jonathan Nez (D) 136,344 · 49.2% | Eli Crane (inc.) (R) 136,258 · 49.1% |
| Arizona 3 | Yassamin Ansari (inc.) (D) 103,137 · 87.4% | David Redkey (I) 6,422 · 5.4% |
| Arizona 4 | Greg Stanton (inc.) (D) 132,395 · 62.4% | Zuhdi Jasser (R) 75,216 · 35.4% |
| Arkansas 1 | Rick Crawford (inc.) (R) 126,952 · 65.5% | Terri Yarbrough Green (D) 60,073 · 31.0% |
| Arkansas 2 | French Hill (inc.) (R) 127,427 · 50.9% | Chris Jones (D) 123,025 · 49.1% |
| Arkansas 3 | Steve Womack (inc.) (R) 127,303 · 54.9% | Robb Ryerse (D) 96,189 · 41.5% |
| Arkansas 4 | Bruce Westerman (inc.) (R) 131,253 · 65.5% | James Russell III (D) 69,153 · 34.5% |
| California 1 | Mike McGuire (D) 88,089 · 57.0% | James Gallagher (inc.) (R) 66,369 · 43.0% |
| California 2 | Jared Huffman (inc.) (D) 105,910 · 67.8% | Robin Littau (R) 50,258 · 32.2% |
| California 3 | Ami Bera (inc.) (D) 95,372 · 57.1% | Robb Tucker (R) 71,774 · 42.9% |
| California 4 | Eric Jones (D) 61,929 · 51.8% | Mike Thompson (inc.) (D) 57,671 · 48.2% |
| Connecticut 1 | Luke Bronin (D) 151,762 · 65.1% | Amy Chai (R) 77,427 · 33.2% |
| Connecticut 2 | Joe Courtney (inc.) (D) 175,368 · 62.5% | George Austin (R) 105,353 · 37.5% |
| Connecticut 3 | Rosa DeLauro (inc.) (D) 144,037 · 60.4% | Christopher Lancia (R) 86,895 · 36.4% |
| Connecticut 4 | Jim Himes (inc.) (D) 156,445 · 65.5% | Michael Goldstein (R) 77,960 · 32.6% |
| Delaware 1 | Sarah McBride (inc.) (D) 243,467 · 64.3% | Joseph Arminio (R) 134,966 · 35.7% |
| Florida 1 | Jimmy Patronis (inc.) (R) 181,723 · 62.6% | Gay Valimont (D) 103,429 · 35.6% |
| Florida 2 | Austin Rogers (R) 160,968 · 52.1% | Amanda Green (D) 147,791 · 47.9% |
| Florida 3 | Kat Cammack (inc.) (R) 165,313 · 55.1% | Seth Harp (D) 128,866 · 43.0% |
| Florida 4 | Aaron Bean (inc.) (R) 151,095 · 50.2% | LaShonda Holloway (D) 144,752 · 48.1% |
| Georgia 1 | Jim Kingston (R) 140,216 · 51.4% | Amanda Hollowell (D) 132,465 · 48.6% |
| Georgia 2 | Sanford Bishop (inc.) (D) 148,193 · 60.9% | Matt Day (R) 95,263 · 39.1% |
| Georgia 3 | Brian Jack (inc.) (R) 188,569 · 58.6% | Maura Keller (D) 133,120 · 41.4% |
| Georgia 4 | Hank Johnson Jr. (inc.) (D) 217,144 · 82.6% | Jim Duffie (R) 45,619 · 17.4% |
| Hawaii 1 | Ed Case (inc.) (D) 115,188 · 72.9% | Adriel Lam (R) 34,958 · 22.1% |
| Hawaii 2 | Jill Tokuda (inc.) (D) 126,197 · 67.1% | Brenton Awa (R) 61,839 · 32.9% |
| Idaho 1 | Russ Fulcher (inc.) (R) 243,591 · 64.3% | Kaylee Peterson (D) 108,996 · 28.8% |
| Idaho 2 | Mike Simpson (inc.) (R) 170,721 · 51.7% | Ellie Gilbreath (D) 133,062 · 40.3% |
| Illinois 1 | Jonathan Jackson (inc.) (D) 153,249 · 70.3% | Christian Maxwell (R) 64,726 · 29.7% |
| Illinois 2 | Donna Miller (D) 151,056 · 72.7% | Michael Noack (R) 56,729 · 27.3% |
| Illinois 3 | Delia Ramirez (inc.) (D) 137,034 · 75.8% | Angel Oakley (R) 43,675 · 24.2% |
| Illinois 4 | Patty Garcia (D) 107,469 · 70.9% | Lupe Castillo (R) 24,669 · 16.3% |
| Indiana 1 | Frank Mrvan (inc.) (D) 142,213 · 63.0% | Barb Regnitz (R) 83,468 · 37.0% |
| Indiana 2 | Rudy Yakym (inc.) (R) 99,148 · 51.3% | Jamee Decio (D) 89,173 · 46.1% |
| Indiana 3 | Marlin Stutzman (inc.) (R) 109,692 · 54.9% | Kelly Thompson (D) 90,180 · 45.1% |
| Indiana 4 | Jim Baird (inc.) (R) 112,408 · 54.2% | Drew Cox (D) 95,115 · 45.8% |
| Iowa 1 | Christina Bohannan (D) 182,396 · 52.8% | Mariannette Miller-Meeks (inc.) (R) 150,471 · 43.6% |
| Iowa 2 | Lindsay James (D) 171,512 · 49.5% | Joe Mitchell (R) 157,722 · 45.6% |
| Iowa 3 | Sarah Trone Garriott (D) 189,217 · 53.7% | Zach Nunn (inc.) (R) 163,441 · 46.3% |
| Iowa 4 | Chris McGowan (R) 178,845 · 59.1% | Dave Dawson (D) 123,940 · 40.9% |
| Kansas 1 | Tracey Mann (inc.) (R) 149,782 · 59.6% | Lauren Reinhold (D) 94,677 · 37.7% |
| Kansas 2 | Derek Schmidt (inc.) (R) 125,043 · 51.4% | Don Coover (D) 109,119 · 44.9% |
| Kansas 3 | Sharice Davids (inc.) (D) 200,463 · 59.6% | Eric Jenkins (R) 129,248 · 38.4% |
| Kansas 4 | Ron Estes (inc.) (R) 138,447 · 53.6% | Katy Tyndell (D) 113,553 · 44.0% |
| Kentucky 1 | James Comer (inc.) (R) 154,910 · 67.6% | John Williams (D) 74,260 · 32.4% |
| Kentucky 2 | Brett Guthrie (inc.) (R) 145,139 · 62.8% | Megan Wingfield (D) 81,111 · 35.1% |
| Kentucky 3 | Morgan McGarvey (inc.) (D) 174,775 · 70.3% | Maria Rodriguez (R) 73,717 · 29.7% |
| Louisiana 1 | Steve Scalise (inc.) (R) 159,890 · 60.7% | Lauren Jewett (D) 89,348 · 33.9% |
| Louisiana 2 | Troy Carter Sr. (inc.) (D) 192,258 · 79.9% | Peter Williams (R) 36,367 · 15.1% |
| Louisiana 3 | Clay Higgins (inc.) (R) 129,203 · 55.0% | John Day (D) 49,162 · 20.9% |
| Louisiana 4 | Mike Johnson (inc.) (R) 134,739 · 58.5% | Conrad Cable (D) 52,893 · 23.0% |
| Maine 1 | Chellie Pingree (inc.) (D) 246,117 · 66.2% | Ronald Russell (R) 125,671 · 33.8% |
| Maine 2 | Paul LePage (R) 155,335 · 50.1% | Matthew Dunlap (D) 154,415 · 49.8% |
| Maryland 1 | Andy Harris (inc.) (R) 150,615 · 55.8% | Dan Schwartz (D) 119,088 · 44.2% |
| Maryland 2 | Johnny Olszewski Jr. (inc.) (D) 144,727 · 61.6% | Dave Wallace (R) 90,370 · 38.4% |
| Maryland 3 | Sarah Elfreth (inc.) (D) 173,282 · 65.4% | Berney Flowers (R) 91,627 · 34.6% |
| Maryland 4 | Glenn Ivey (inc.) (D) 145,407 · 89.1% | George McDermott (R) 10,374 · 6.4% |
| Massachusetts 1 | Richard Neal (inc.) (D) 168,982 · 65.1% | Nadia Milleron (I) 90,397 · 34.9% |
| Massachusetts 2 | James McGovern (inc.) (D) | No votes reported |
| Massachusetts 3 | Lori Trahan (inc.) (D) 159,573 · 66.2% | Gary Grossi (R) 75,134 · 31.2% |
| Massachusetts 4 | Jake Auchincloss (inc.) (D) 163,838 · 64.3% | Thomas Stalcup (R) 90,901 · 35.7% |
| Michigan 1 | Jack Bergman (inc.) (R) 216,960 · 53.8% | Callie Barr (D) 178,381 · 44.2% |
| Michigan 2 | John Moolenaar (inc.) (R) 219,289 · 61.5% | Ben Ambrose (D) 131,969 · 37.0% |
| Michigan 3 | Hillary Scholten (inc.) (D) 211,061 · 57.1% | Terri DeBoer (R) 152,988 · 41.4% |
| Michigan 4 | Sean McCann (D) 185,440 · 50.1% | Bill Huizenga (inc.) (R) 178,741 · 48.3% |
| Minnesota 1 | Jake Johnson (D) 163,056 · 50.0% | Brad Finstad (inc.) (R) 162,733 · 49.9% |
| Minnesota 2 | Matt Little (D) 214,255 · 57.1% | Eric Pratt (R) 160,636 · 42.8% |
| Minnesota 3 | Kelly Morrison (inc.) (D) 242,079 · 64.0% | Tyler Bass (R) 135,505 · 35.8% |
| Minnesota 4 | Betty McCollum (inc.) (D) 245,699 · 73.1% | Paul Wikstrom (R) 90,068 · 26.8% |
| Mississippi 1 | Trent Kelly (inc.) (R) 138,744 · 58.7% | Cliff Johnson (D) 94,273 · 39.9% |
| Mississippi 2 | Bennie Thompson (inc.) (D) 164,301 · 67.6% | Ron Eller (R) 73,013 · 30.0% |
| Mississippi 3 | Michael Guest (inc.) (R) 143,578 · 57.8% | Michael Chiaradio (D) 101,882 · 41.0% |
| Mississippi 4 | Mike Ezell (inc.) (R) 131,074 · 61.1% | Jeffrey Hulum III (D) 76,856 · 35.8% |
| Missouri 1 | Wesley Bell (inc.) (D) 189,175 · 81.5% | Paul Berry III (R) 32,362 · 13.9% |
| Missouri 2 | Fred Wellman (D) 169,477 · 51.1% | Ann Wagner (inc.) (R) 153,132 · 46.2% |
| Missouri 3 | Bob Onder (inc.) (R) 149,239 · 52.9% | Bethany Mann (D) 125,271 · 44.4% |
| Missouri 4 | Mark Alford (inc.) (R) 150,944 · 61.2% | Jordan Herrera (D) 88,423 · 35.9% |
| Montana 1 | Sam Forstag (D) 119,434 · 49.9% | Aaron Flint (R) 113,022 · 47.2% |
| Montana 2 | Troy Downing (inc.) (R) 126,740 · 58.2% | Brian Miller (D) 70,161 · 32.2% |
District results, Nebraska to Wyoming
Washington, Utah and Oregon districts show the lowest share of votes counted, so their margins are the least settled.
| District | Leading | Trailing |
| Nebraska 1 | Mike Flood (inc.) (R) 124,881 · 50.3% | Chris Backemeyer (D) 114,664 · 46.2% |
| Nebraska 2 | Denise Powell (D) 138,733 · 56.4% | Brinker Harding (R) 100,895 · 41.0% |
| Nebraska 3 | Adrian Smith (inc.) (R) 173,220 · 71.0% | Becky Stille (D) 48,842 · 20.0% |
| Nevada 1 | Dina Titus (inc.) (D) 127,098 · 59.0% | Carrie Buck (R) 81,873 · 38.0% |
| Nevada 2 | Teresa Benitez-Thompson (D) 145,046 · 50.7% | David Flippo (R) 126,186 · 44.1% |
| Nevada 3 | Susie Lee (inc.) (D) 146,863 · 59.1% | Marty O’Donnell (R) 95,845 · 38.6% |
| Nevada 4 | Steven Horsford (inc.) (D) 134,980 · 60.5% | Cody Whipple (R) 84,017 · 37.7% |
| New Hampshire 1 | Stefany Shaheen (D) 175,456 · 57.2% | Anthony DiLorenzo (R) 131,407 · 42.8% |
| New Hampshire 2 | Maggie Goodlander (inc.) (D) 175,599 · 59.0% | Lily Tang Williams (R) 115,235 · 38.7% |
| New Jersey 1 | Donald Norcross (inc.) (D) 176,028 · 70.2% | Damon Galdo (R) 74,655 · 29.8% |
| New Jersey 2 | Zack Mullock (D) 136,573 · 50.8% | Jeff Van Drew (inc.) (R) 129,541 · 48.2% |
| New Jersey 3 | Herb Conaway (inc.) (D) 169,036 · 62.4% | Michael McGuire (R) 96,539 · 35.7% |
| New Mexico 1 | Melanie Stansbury (inc.) (D) 178,261 · 63.5% | Ndidiamaka Okpareke (R) 102,301 · 36.5% |
| New Mexico 2 | Gabriel Vasquez (inc.) (D) 123,113 · 58.7% | Gregory Cunningham (R) 86,650 · 41.3% |
| New Mexico 3 | Teresa Leger Fernandez (inc.) (D) 139,967 · 61.5% | Martin Zamora (R) 87,653 · 38.5% |
| New York 1 | Nicholas LaLota (inc.) (R) 152,546 · 51.1% | Christopher Gallant (D) 145,869 · 48.9% |
| New York 2 | Andrew Garbarino (inc.) (R) 128,090 · 51.6% | Patrick Halpin (D) 120,157 · 48.4% |
| New York 3 | Thomas Suozzi (inc.) (D) 148,216 · 54.8% | Michael LiPetri Jr. (R) 121,623 · 45.0% |
| North Carolina 1 | Don Davis (inc.) (D) 156,564 · 50.1% | Laurie Buckhout (R) 146,259 · 46.8% |
| North Carolina 2 | Deborah Ross (inc.) (D) 245,402 · 75.1% | Eugene Douglass (R) 76,763 · 23.5% |
| North Carolina 3 | Greg Murphy (inc.) (R) 117,583 · 49.4% | Raymond Smith (D) 117,350 · 49.3% |
| North Dakota 1 | Julie Fedorchak (inc.) (R) 134,477 · 57.4% | Trygve Hammer (D) 85,892 · 36.7% |
| Ohio 1 | Greg Landsman (inc.) (D) 176,453 · 54.4% | Eric Conroy (R) 139,343 · 42.9% |
| Ohio 2 | David Taylor (inc.) (R) 175,411 · 64.2% | Jen Mazzuckelli (D) 97,638 · 35.8% |
| Ohio 3 | Joyce Beatty (inc.) (D) 231,925 · 77.2% | Cleophus Dulaney (R) 68,407 · 22.8% |
| Oklahoma 1 | Mark Tedford (R) 121,260 · 52.3% | John Croisant (D) 110,521 · 47.7% |
| Oklahoma 2 | Josh Brecheen (inc.) (R) 143,983 · 68.0% | Brandon Wade (D) 61,378 · 29.0% |
| Oklahoma 3 | Frank Lucas (inc.) (R) 122,138 · 64.0% | Suzie Byrd (D) 68,787 · 36.0% |
| Oregon 1 | Suzanne Bonamici (inc.) (D) 154,258 · 69.6% | Barbara Kahl (R) 67,166 · 30.3% |
| Oregon 2 | Cliff Bentz (inc.) (R) 185,667 · 61.5% | Chris Beck (D) 115,716 · 38.3% |
| Oregon 3 | Maxine Dexter (inc.) (D) 164,418 · 76.1% | Loran Ayles (R) 51,095 · 23.7% |
| Oregon 4 | Val Hoyle (inc.) (D) 148,206 · 54.0% | Monique DeSpain (R) 117,621 · 42.9% |
| Pennsylvania 1 | Bob Harvie (D) 188,011 · 52.7% | Brian Fitzpatrick (inc.) (R) 168,470 · 47.3% |
| Pennsylvania 2 | Brendan Boyle (inc.) (D) 146,297 · 80.7% | Jessica Arriaga (R) 34,914 · 19.3% |
| Pennsylvania 3 | Chris Rabb (D) 252,129 · 93.6% | Dennis Mahoney (I) 17,237 · 6.4% |
| Pennsylvania 4 | Madeleine Dean (inc.) (D) 231,425 · 67.1% | Aurora Stuski (R) 113,464 · 32.9% |
| South Carolina 1 | Nancy Lacore (D) 161,878 · 49.7% | Jenny Costa Honeycutt (R) 158,570 · 48.6% |
| South Carolina 2 | Joe Wilson (inc.) (R) 147,620 · 49.8% | Zyon Khalifa (D) 144,593 · 48.8% |
| South Carolina 3 | Sheri Biggs (inc.) (R) 173,801 · 63.7% | Eunice Lehmacher (D) 93,821 · 34.4% |
| South Carolina 4 | William Timmons (inc.) (R) 146,808 · 51.7% | Courtney McClain (D) 129,561 · 45.6% |
| Tennessee 1 | Diana Harshbarger (inc.) (R) 141,117 · 67.4% | Kristi Burke (D) 61,682 · 29.5% |
| Tennessee 2 | Tim Burchett (inc.) (R) 144,892 · 57.7% | Michaela Barnett (D) 103,311 · 41.2% |
| Tennessee 3 | Chuck Fleischmann (inc.) (R) 136,110 · 57.6% | Anna Golladay (D) 95,051 · 40.2% |
| Tennessee 4 | Victoria Broderick (D) 95,585 · 48.9% | Scott DesJarlais (inc.) (R) 95,305 · 48.7% |
| Texas 1 | Nathaniel Moran (inc.) (R) 181,987 · 69.0% | Yolanda Prince (D) 81,598 · 31.0% |
| Texas 2 | Steve Toth (R) 144,748 · 51.0% | Shaun Finnie (D) 139,167 · 49.0% |
| Texas 3 | Keith Self (inc.) (R) 169,243 · 52.7% | Evan Hunt (D) 151,667 · 47.3% |
| Texas 4 | Pat Fallon (inc.) (R) 171,652 · 56.1% | Jason Pearce (D) 134,563 · 43.9% |
| Utah 1 | Ben McAdams (D) 128,961 · 71.9% | Riley Owen (R) 44,607 · 24.9% |
| Utah 2 | Blake Moore (inc.) (R) 95,926 · 49.8% | Peter Crosby (D) 83,211 · 43.2% |
| Utah 3 | Celeste Maloy (inc.) (R) 97,974 · 57.9% | Kent Udell (D) 59,899 · 35.4% |
| Utah 4 | Mike Kennedy (inc.) (R) 87,002 · 51.9% | Jonny Larsen (D) 69,735 · 41.6% |
| Vermont 1 | Becca Balint (inc.) (D) 198,675 · 65.2% | Gerald Malloy (R) 94,018 · 30.9% |
| Virginia 1 | Shannon Taylor (D) 207,877 · 51.0% | Rob Wittman (inc.) (R) 198,417 · 48.7% |
| Virginia 2 | Elaine Luria (D) 178,697 · 53.1% | Jen Kiggans (inc.) (R) 150,082 · 44.6% |
| Virginia 3 | Bobby Scott (inc.) (D) 179,292 · 72.6% | Edwin Rivera Jr. (R) 59,380 · 24.0% |
| Virginia 4 | Jennifer McClellan (inc.) (D) 222,936 · 72.2% | Robert Murray Jr. (R) 81,148 · 26.3% |
| Washington 1 | Suzan DelBene (inc.) (D) 128,234 · 67.9% | Mary Silva (R) 59,950 · 31.8% |
| Washington 2 | Rick Larsen (inc.) (D) 159,891 · 67.9% | Edwin Feller (R) 74,732 · 31.7% |
| Washington 3 | Marie Gluesenkamp Perez (inc.) (D) 143,417 · 55.0% | John Braun (R) 115,271 · 44.2% |
| Washington 4 | Amanda McKinney (R) 74,133 · 54.1% | John Duresky (D) 62,569 · 45.7% |
| West Virginia 1 | Carol Miller (inc.) (R) 118,735 · 57.1% | Vince George (D) 82,347 · 39.6% |
| West Virginia 2 | Riley Moore (inc.) (R) 143,757 · 59.4% | Ace Parsi (D) 98,235 · 40.6% |
| Wisconsin 1 | Mitchell Berman (D) 158,839 · 52.0% | Bryan Steil (inc.) (R) 146,885 · 48.0% |
| Wisconsin 2 | Mark Pocan (inc.) (D) 298,359 · 100% | No opponent listed |
| Wisconsin 3 | Rebecca Cooke (D) 172,757 · 52.4% | Derrick Van Orden (inc.) (R) 150,872 · 45.8% |
| Wisconsin 4 | Gwen Moore (inc.) (D) 211,898 · 80.0% | Tim Rogers (R) 46,301 · 17.5% |
| Wyoming 1 | Chuck Gray (R) 99,891 · 54.5% | Lisa Kinney (D) 61,687 · 33.7% |