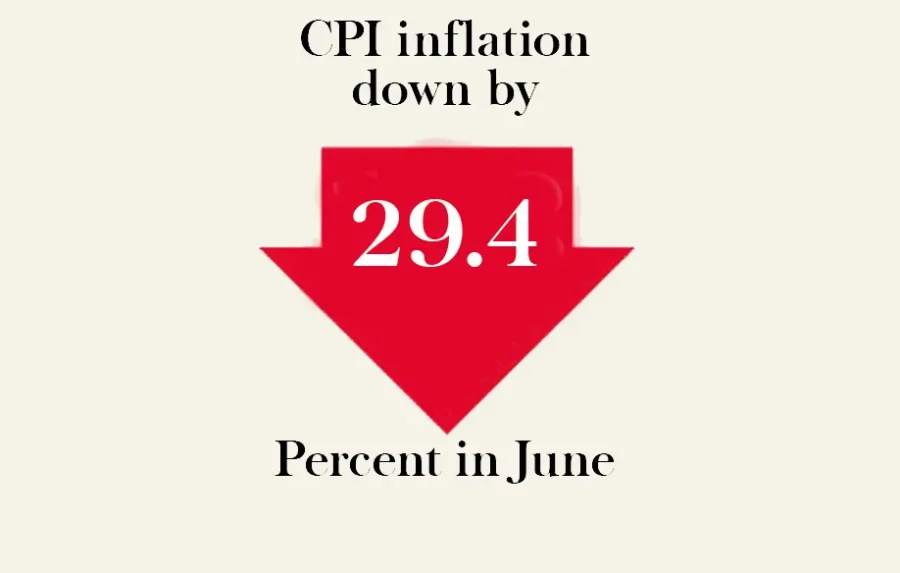
Minister for Finance and Revenue Senator Mohammad Ishaq Dar said on Monday that the Consumer Price Index (CPI)-based inflation came down to 29.4 percent during the month of June
2023 as compared to 38 percent recorded during May 2023.
“As per the data released by the Pakistan Bureau of Statistics (PBS), the CPI inflation for Jun 2023 clocked in at 29.4 percent compared to 38 percent YoY for May’23,” the federal minister said in a tweet.
Ishaq Dar said the Pakistan Stock Exchange (PSX) had also performed well “as 2,334 points were added to the index by 1:00 p.m on Monday whereas at the exchange rate of Pak Rupee vs Dollar in open Market was recorded at Rs.270/272.”
Meanwhile, the Pakistan Bureau of Statistics (PBS) reported that the CPI-based inflation reached 29.4 per cent on a year-on-year (YoY) basis in June 2023 as compared to 38 percent in the previous month and 21.3 percent in June 2022.
On a month-on-month basis, it decreased to 0.3 percent in January 2023 as compared to an increase of 1.6 percent in the previous month (May 2023) and an increase of 6.3 percent in June 2022.
On a year-on-year basis, the top few food commodities that witnessed an increase in prices as compared to the corresponding month of last year included cigarettes (129.20 percent), Tea (113.09 percent), Wheat Flour (89.89 percent), Rice (72.83 percent), Potatoes (64.69 percent), Wheat (62.27 percent), Chicken (57.72 percent), Wheat Products (56.81 percent), Pulse Moong (50.50 percent), Pulse Mash (49.92 percent), Beans (47.60 percent), Ready-made Food (43.04 percent), Sugar (41.64 percent), Fresh Fruits (40.31 percent), Beverages (38.17 percent), Eggs (36.96 percent), Bakery and Confectionery (36.83 percent), Gur (36.60 percent),
Milk Fresh (31.8 percent), Condiments and Spices (30.04 percent), Gram Whole (28.42 percent), Pulse Gram (24.14 percent), Cooking Oil (19.62 percent), Meat (18.50 percent), Fresh Vegetables (13.71 percent),
Vegetable Ghee (8.90 percent) and Mustard Oil (5.97 percent), while tomatoes came down by 29.57 percent and onion 16.53 percent.
The non-food commodities that witnessed an increase during the period on a YoY basis included.


