Source: Research Team, China Institute for Reform and Development (CIRD), May 2024
The Regional Comprehensive Economic Partnership (RCEP) has garnered substantial attention since its inception. Despite navigating a challenging journey and a turbulent global economic landscape, the implementation of RCEP has started to yield positive results, providing crucial certainty in uncertain times.
The future of RCEP looks promising, with strong expectations for promoting ASEAN-led regional economic integration.
An Assessment Report based on relevant data offers a preliminary analysis of RCEP’s progress since its official implementation in 2022 and provides recommendations for maximizing its benefits.
Overall Assessments
First, RCEP’s dividends have started to be unleashed. Taking trade and investment as an example, the effect of RCEP’s implementation on driving regional trade and investment growth has begun to appear, with its trade promotion effects on ASEAN members more obvious.
Second, some members’ utilisation rate of RCEP rules needs improvement. Currently, some members’ low utilization of RCEP rules is a salient issue facing the comprehensive implementation of RCEP.
Third, RCEP has enormous potential dividends. There is huge room for unleashing the benefits of RCEP in areas such as trade and investment, utilisation of rules by enterprises, and policy implementation.
Fourth, RCEP’s dividends can be fully released by giving priority to raising the utilisation rate of its rules. Utilisation of Rules of Origin (RoO) is the foundation and strut for releasing the benefits of any free trade agreement. Improving the utilisation rate of RCEP’s rules of origin will help create a new pattern of sharing dividends and jointly promoting development in the RCEP region.
Progress: RCEP’s Dividends Have Started to be Unleashed
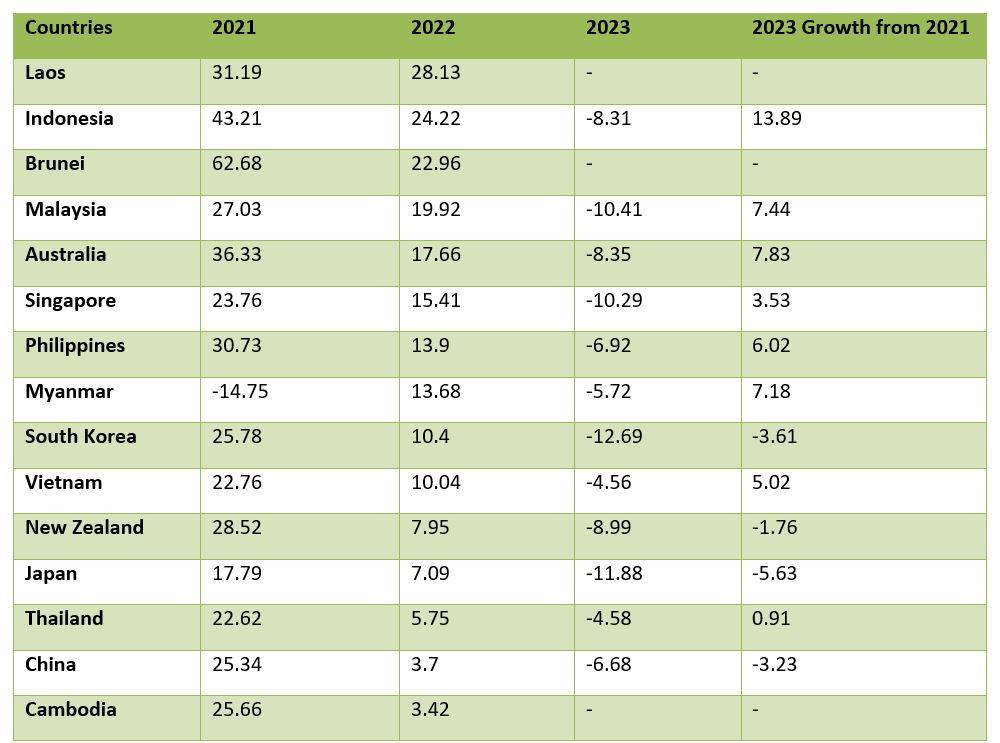
RCEP’s implementation propelled rapid growth in intra-regional trade. In 2022, the quantity of intra-regional trade of all 15 RCEP members significantly increased, with 10 members achieving double-digit growth. RCEP’s trade promotion effect on ASEAN countries, particularly on its less developed economies, is generally greater than that on other RCEP members. In addition, in 2022 and 2023, the proportion of trade of most members with ASEAN countries in their total intra-regional trade was higher than that in 2021.
Figure 1: 2021-2023 Annual Growth Rate of Intra-regional Trade for RCEP Members (%)
Source: Research Team calculation based on data from GLOBAL TRADE FLOW
Read More: RCEP boosting ASEAN economic integration into global economy
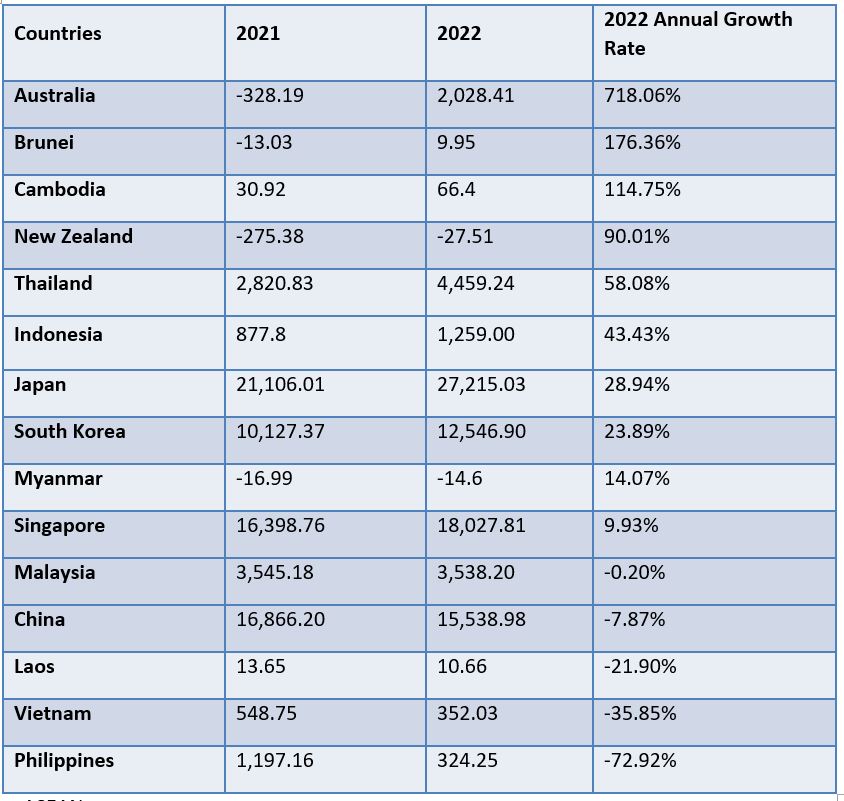
RCEP’s implementation propelled growth in investment in the region. In 2022, RCEP’s 15 members attracted $531.11 billion of foreign direct investment (FDI), an increase of 13.9% year-on-year; outward FDI reached $577.46 billion, up 21.7% year-on-year. In 2022, FDI flows from most RCEP member economies to ASEAN achieved positive year-on-year growth.
Figure 2: 2021-2022 Inward FDI Flows from RCEP Members to ASEAN ($ million)
Source: ASEANstats
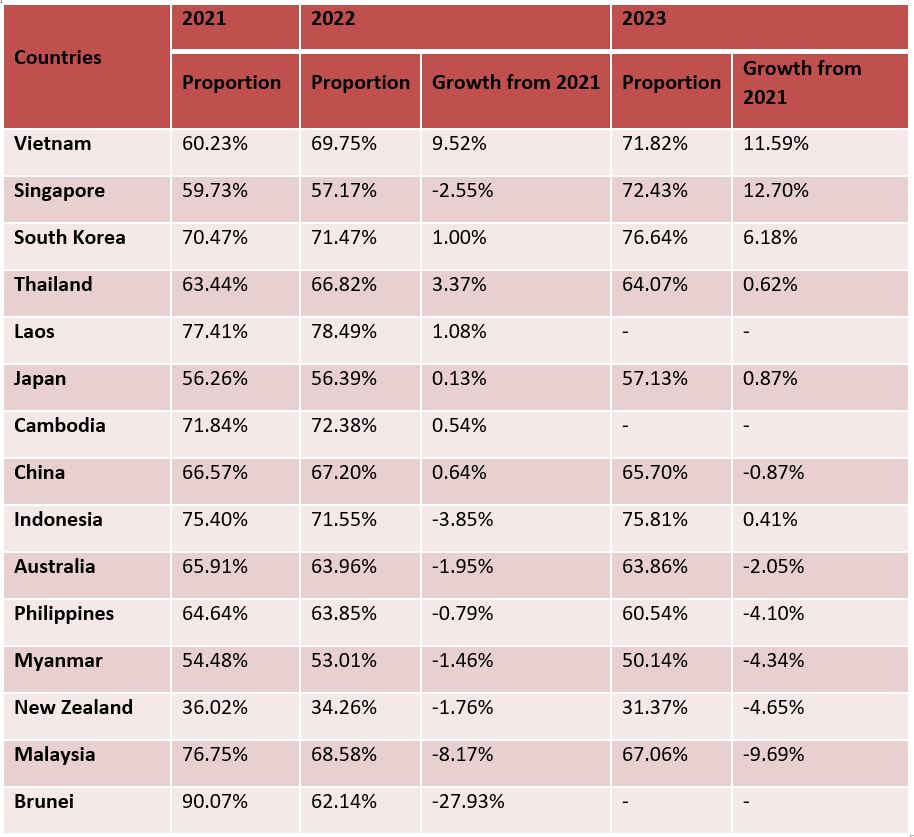
RCEP’s implementation propelled the development of the industrial and supply chains in the region. Trade in intermediate goods reflects the effectiveness of industrial and supply chain network construction. In the RCEP region, the proportion of intra-regional trade in intermediate goods in the total intra-regional trade rose from 64.5% in 2021 to 65% in 2022, and then to 66% in 2023. The proportion of Vietnam, Singapore and Korea’s intra-regional trade in intermediate goods in their total intra-regional trade saw larger increase. Vietnam experienced the largest increase, with the proportion of its trade in intermediate goods in the total trade in the RCEP region increasing from 60.23% in 2021 to 69.75% in 2022, and then 71.82% in 2023.
Figure 3: 2021-2023 Proportion of Trade in Intermediate Goods in Intra-regional Trade for RCEP Members (%)
Source: Research Team calculation based on data from UNCTAD
RCEP’s implementation propelled the economic growth in less-developed member economies. In 2022, the annual growth rate of trade of less developed economies such as Laos, Myanmar, and Cambodia with other RCEP members reached 28.13%, 13.68% and 3.42% respectively. In the same year, the three countries’ GDP grew at the rate of 2.7%, 3.8%, and 5.4% respectively. Laos achieved the highest growth in trade with other RCEP members in 2022, which became a significant driver of its economic growth.
Read More: Regional economic partnership reflects Indonesia’s commitment to promote integration
RCEP’s implementation propelled economic and trade integration among China, Japan, and South Korea. RCEP has made up for the absence of free trade agreements between China and Japan, and between Japan and South Korea, and has facilitated market connectivity between the three countries. Within 2022, RCEP has become the free trade agreement under which Japan granted the largest value of preferential imports, with imports from China accounting for 88.5% of the total value of preferential imports. Under the RCEP, South Korea’s preferential exports reached $3.3 billion, with 67.3% going to Japan and 27.7% going to China.
Challenges: The Utilisation Rate of RCEP Rules of Origins Needs Improvement
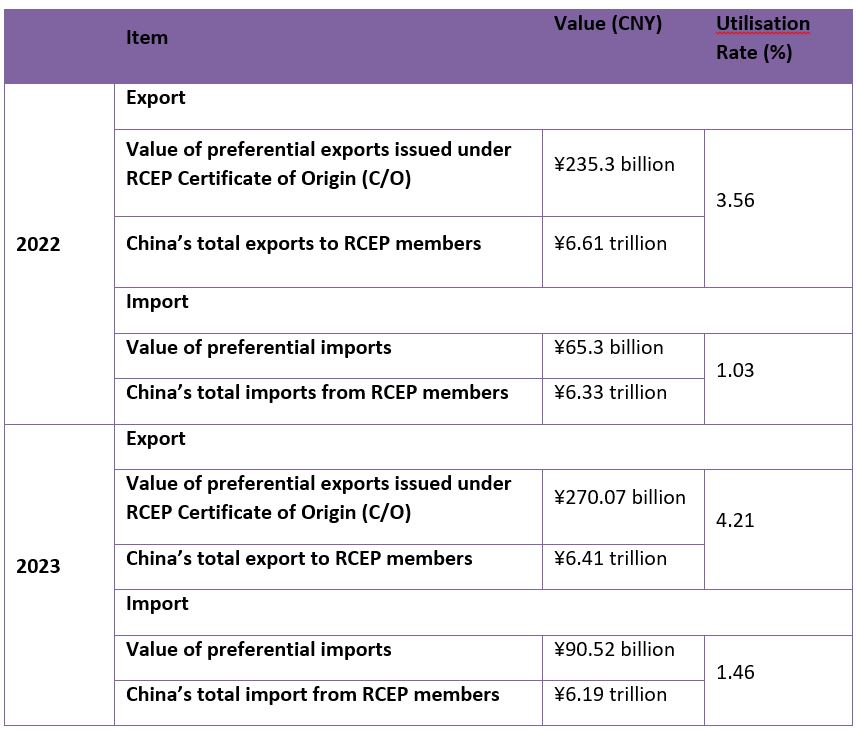
1.China’s utilisation rate of RCEP rules of origin (RoO) leaves significant room for improvement. According to preliminary estimates by CIRD Research Team, in 2022, Chinese enterprises’ utilisation rate of rules of origin was 3.56% for exports and 1.03% for imports respectively. In 2023, the two rates rose to 4.21% and 1.16%, still leaving considerable room for improvement in the utilisation rate of RCEP rules by Chinese enterprises.
Figure 4: 2022-2023 Chinese Enterprises’ Utilisation Rate of RCEP Rules of Origin
Source: Research Team calculation based on open data
2.Some ASEAN members have rather low utilisation rates of rules of origin. In 2022, Vietnam’s utilisation rate of RCEP rules of origin for exports was 0.67%, Thailand’s utilisation rate of RCEP rules of origin for exports was 1.9%, and Malaysia’s utilisation rate of RCEP rules of origin for exports was only 0.07%.
3.The overall low utilisation rate of RCEP rules of origin restricts the release of RCEP benefits. Although the utilisation of RCEP rules in trade between China, Japan, and South Korea is relatively better, the utilisation rate of RCEP in trade involving ASEAN countries is not high. If the utilisation rate of RCEP rules of origin is significantly improved, the regional economic and trade cooperation will be further deepened and RCEP benefits will be further released.
Read More: RCEP energizing regional trade, boosting cross-border cooperation
III. Prospects: RCEP Will Bring Enormous Benefits
1.There is a large space for trade and investment growth in the RCEP region. It is estimated that the cumulative quantity of increase in exports and imports in the RCEP region will exceed $1.84 trillion by 2035. And thanks to the diversity and complementarity of industries in the RCEP region, RCEP is expected to propel FDI in the region to grow by 1.47% in the region by 2035.
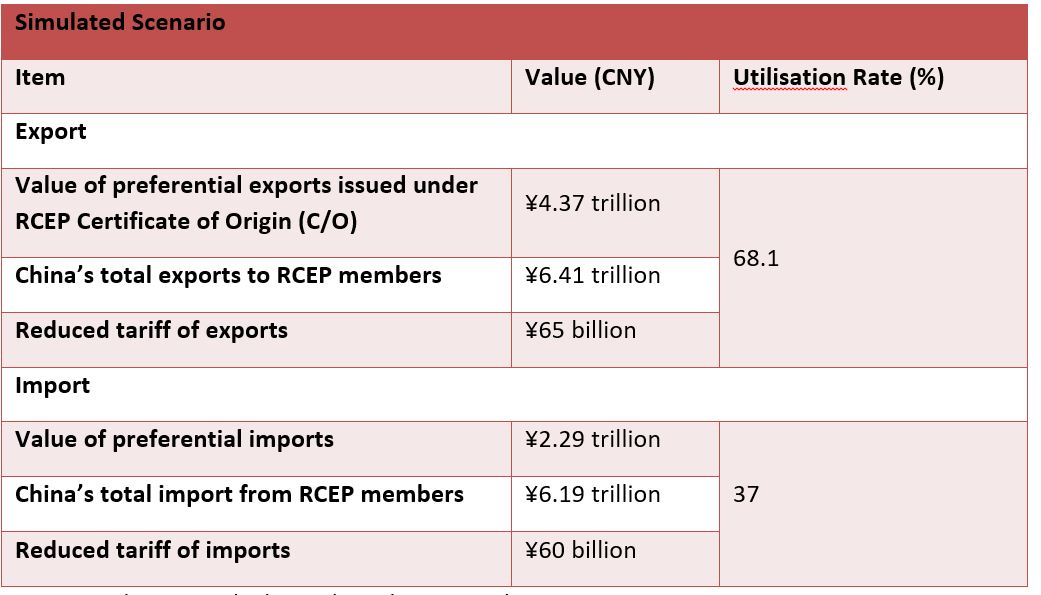
2.There is huge room for enterprises to improve the level of tariff preferences enjoyed. Take China’s utilisation of RCEP as an example. If Chinese enterprises’ utilisation rate of RCEP rules reaches the utilisation rate of South Korea’s trade with Japan, then, under the current volume of intra-regional trade, the quantity of preferential tariff offered to China’s imports will rise from 2.36 billion yuan to 60 billion yuan, tariff concessions enjoyed by China’s exports will rise from 4.05 billion yuan to 65 billion yuan. Meanwhile, there is considerable room for improvement in RCEP’s tariff commitments. If RCEP members accelerate the implementation and improvement of current tariff commitments, enterprises can enjoy more dividends from RCEP tariff reduction.
Figure 5: Simulated Scenario in which China’s Utilisation Rate of RCEP Rules Rise
Source: Research Team calculation based on open data
1.RCEP’s preferential policy has larger advantage. RCEP’s adopts the “regional cumulation” clause that significantly expands the scope of cumulation, and makes the provision of certificates of origin more flexible and convenient. In the field of service trade, RCEP’s schedules of commitments to opening up service trade is broad and has a higher level, which will finally evolve into negative lists. It also introduces three separate annexes regarding finance, telecommunication and professional services. In terms of new economic and trade rules, RCEP contains separate provisions for important issues such as intellectual property, e-commerce, competition, small and medium-sized enterprises, economic and technological cooperation, government procurement, and dispute settlement.
2.RCEP has significant promotion potentials for economic growth. RCEP has enormous potentials for promoting economic growth in ASEAN. If RCEP is fully implemented, the national income of each member economy in ASEAN will increase by 0.6% compared to the current level, adding $245 billion of national income and 2.8 million jobs to the RCEP region.
Actions: Strive to Raise the Utilisation Rate of RCEP Rules
- Raise enterprises’ utilisation rate of RCEP’s rules. Raising the utilisation rate of the Rules of Origin should be a prioritized objective. Pragmatic measures should be taken to raise enterprises’ awareness of RCEP and its rules, reduce enterprises’ costs of using the Rules of Origin, and leverage the government’s role in raising the level of enterprises’ utilisation of RCEP rules.
- Push for the upgrading of RCEP rules. It is recommended to optimize RCEP Rules of Origin, upgrade RCEP Rules of Origin from “regional cumulation” to “full cumulation”, adopt the negative list as mode of commitments for service trade for all members, and expand the scope of the agenda as appropriate.
- Promote the enlargement of RCEP. Accelerate the improvement of RCEP’s accession protocol, support Hong Kong’s accession to RCEP as soon as possible, and attract India to re-join RCEP.
- Enhance synergy for RCEP’s comprehensive implementation. Establish the RCEP Secretariat to strengthen policy coordination among members, improve their understanding of and ability to make use of RCEP related policies, and give full play to the role of think tanks and media in the region.
To evaluate the effects of RCEP implementation comprehensively, the CIRD research team, in communication and discussion with other think tanks of the RCEP Think Tank Network (RCEPTTN), designed the RCEP Utility Index (RUI). This index includes 12 indicators across five dimensions: trade liberalization and convenience, trade promotion, investment promotion and financial development, technology and innovation, and regional value chain. It aims to measure the relative level of benefits brought by RCEP’s implementation to each RCEP member. CIRD will continue to collaborate with think tanks within the RCEP region to carry out further RCEP assessments and related research, contributing new insights from think tanks to the comprehensive implementation of RCEP.
Read More: Cambodia’s exports to RCEP countries up 16 percent
Figure 6: 2022 RCEP Utility Index (RUI) for RCEP Members

Source: Research Team, “ Construction and Assessment of 2022-2023 RCEP Utility Index”, April 2024


